Acquisition and history
Collect machine states, counts and events. Structure useful history by equipment and product.

03 / INDUSTRIAL INTEGRATION
Production data, statistics and operational intelligence. Turn factory events into information that supports your decisions.
PRODUCTION STATISTICS
Compare two shifts in this example. Volumes and downtime reasons point to different investigations.
Good units · target: 600 / hour
Collect machine states, counts and events. Structure useful history by equipment and product.
Combine automatic detection and operator context to track downtime reasons, duration and frequency.
Track production, targets, availability, performance and quality using definitions suited to your process.
Compare products, shifts and periods. Examine trends, changeovers and recurring losses.
INDUSTRY 5.0
Why does this line stop? Which changeover takes the longest? Where are we losing capacity? The operating question determines the data to collect.
Metrics, targets and calculation rules
Sources, events and context
Data quality and consistency on the floor
Reports, follow-up and action priorities
Practical experience with platforms used in Quebec plants.
 HMI / SCADA · IIoT
 AVEVA Edge / InduSoft Web Studio · HMI / SCADA
 Certified integrator
 Industrial automation
We confirm the applicable platforms, versions and interfaces during project assessment.
View project scope examplesIGNITION / INDUSTRIE 5.0
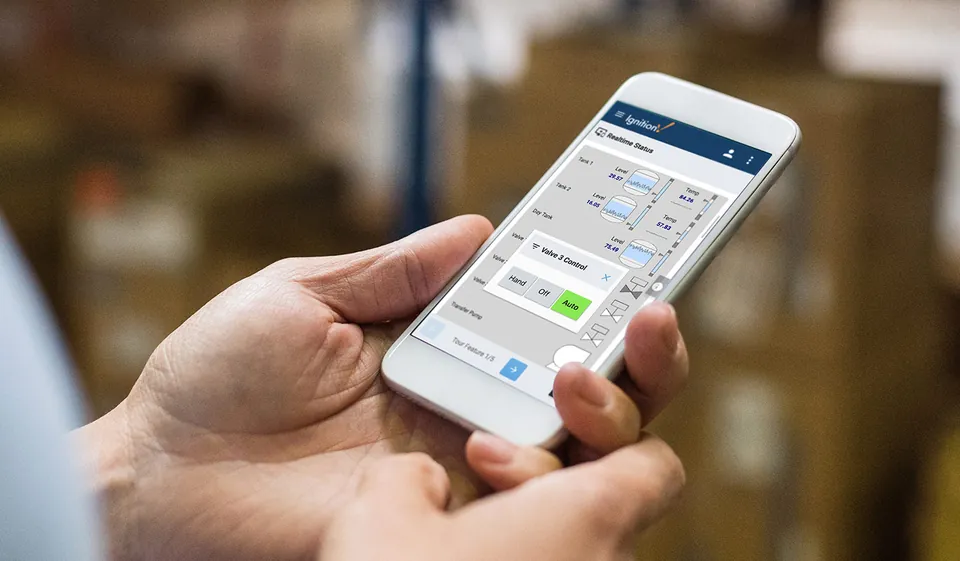
A web interface can make production status, trends and indicators available to the people who need to act, on screens suited to their work.
Let’s discuss your equipment, operators and production objectives.
Discuss my application ↗